Model Training and Prototyping
Road collisions in the UK are classified at 3 levels of severity - slight, serious and fatal. To aid our client Synoptix with an existing project, the team was tasked with analysing which factors lead to more serious collisions, and performing prediction on a collision's severity given the context and conditions it took place in.
Our team worked with collision data sourced from the UK Department for Transport, dating back to 1979. Every collision in the UK is tagged with a rich set of information surrounding the context of the incident, with up to 30 features recorded, including collision severity, location, surrounding weather and light conditions and so on. Following a preliminary filtering of the data to restrict to the Bristol and Somerset region, the team trained a series of models upon these features. It is also important to mention that originally the data was being displayed on the map was split between two different models. Fred V1 and Fred V2, with the former being trained on the same data but with less specific weather data, and the latter being trained with more thorough weather data. This was done to allow for a more accurate representation of how weather impacts collision severity, as well as to allow for a more accurate prediction of the hazard score when more accurate weather data is available. However, it is clear that these 2 models are very similar in their predictions. We recently implemented a new prediction process, splitting the heatmap into specific road segments, for future predictions and backtests. Due to the outdated prediction methods, Fred V1 and V2 were retired, being replaced with a new Conintuous Predictor and eval function.
Although the existing dataset was already of high quality prior to any manipulation by the team, it still required some adjustment prior to model development. While missing values in the dataset could have presented a major problem, the team was lucky to find only one feature (collison_injury_based) had this issue. We chose to ignore this feature altogether, although an alternative approach would have involved artificial injection of dummy data. The dataset also had a mix of categorical and numerical features, so ordinal encoding was performed on all categorical features to allow the training of statistical models. Features were also scaled in a standard approach prior to any model fitting.
Understanding the Hazard Score
The output of the pipelines is the Hazard Score, which represents the forecasted risk of road collisions.
To calculate the score, models process historical features like weather, time of day, and road conditions. During prediction, the score is calculated by applying a weighing to different severities and then combining them for a given time.
The Hazard Score is a value ranging from 0.0 to 1.0. A higher score signifies a greater likelihood of a worse incident. We backtest these scores by rounding them and comparing them against the actual historical collision severities.
Model Interpretability
To understand how our models "think", the team performed analysis on a trained Gradient Booster, using Permutation importance and Partial Plots to illustrate how different features played into the model's decision making process. In doing so, we were able to gain valuable insight into which features the model regarded as most or least important, as well as seeing how each feature impacted the model's prediction, pushing a collision to be slight or serious.
Feature importances
Permutation importance score — click a bar to highlight
One of the most important aspects of model interpretability involves understanding which features play the largest part into the predictions a model makes. This information allows us to infer which aspects of a road collision lead the most to higher severity, hence enabling viewers to take these features into greater consideration when using roads. Permutation importance is one of the fundamental techniques used to infer feature importance, and is done on a trained model.
A fitted model is used to predict collision severity for a series of test collisions, and the results are stored. Immediately after, a singular feature column is shuffled randomly, thus breaking any relationship between said collision and that feature, and the model is used to predict severity once again. By comparing the accuracy of prediction when all features are accurate compared to one feature is shuffled, we can deduce how much significance the model places on that feature.
If prediction accuracy is very high in the normal case, and significantly worse when feature X is shuffled, we can safely assume that feature X plays an important role in the model's decision. In contrast if accuracy stays similar in both predictions, we know that feature X does not inform our model's decision as much as other features.
Repeating this process for all the features and ranking them based on how much the accuracy drops, gives us a view of which features the model considers the most and least important.
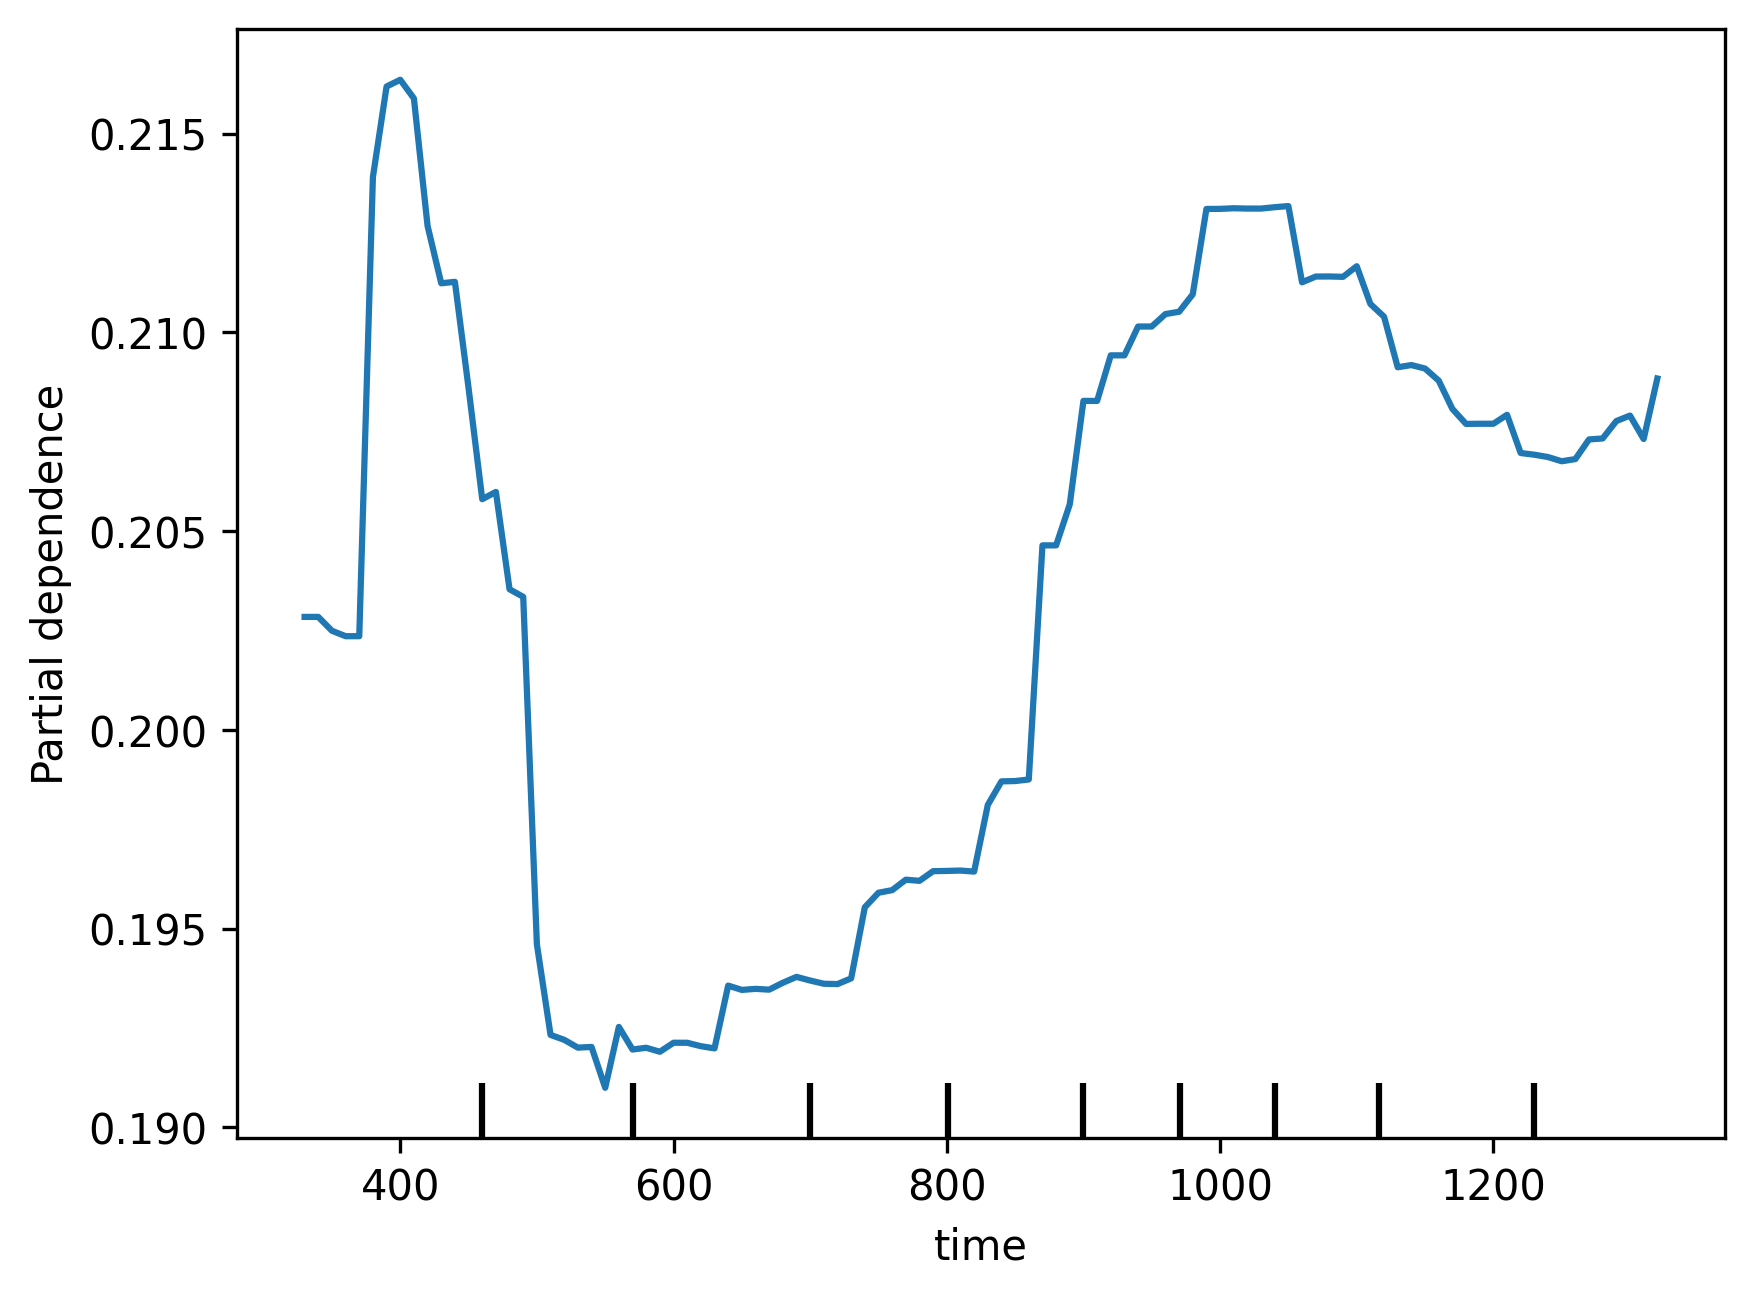
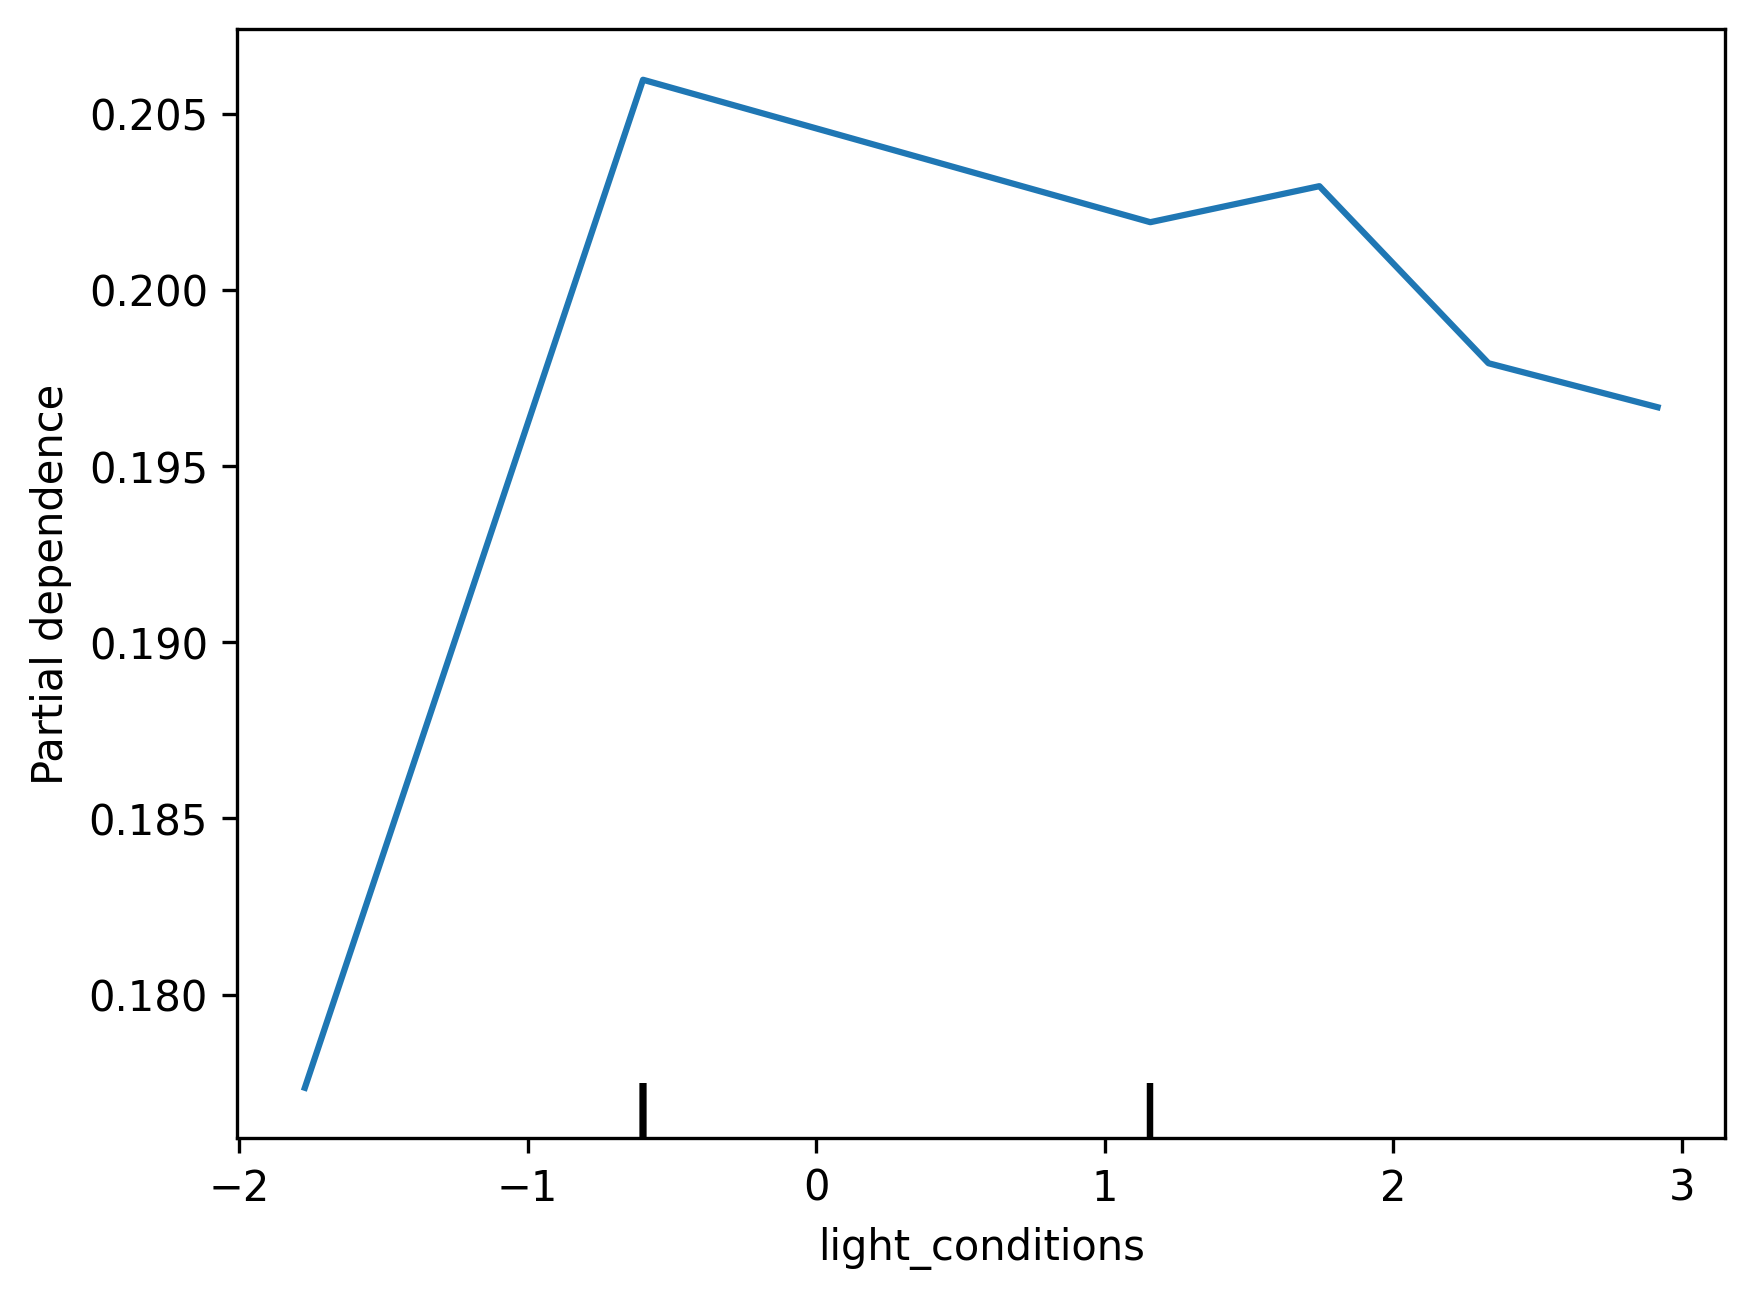
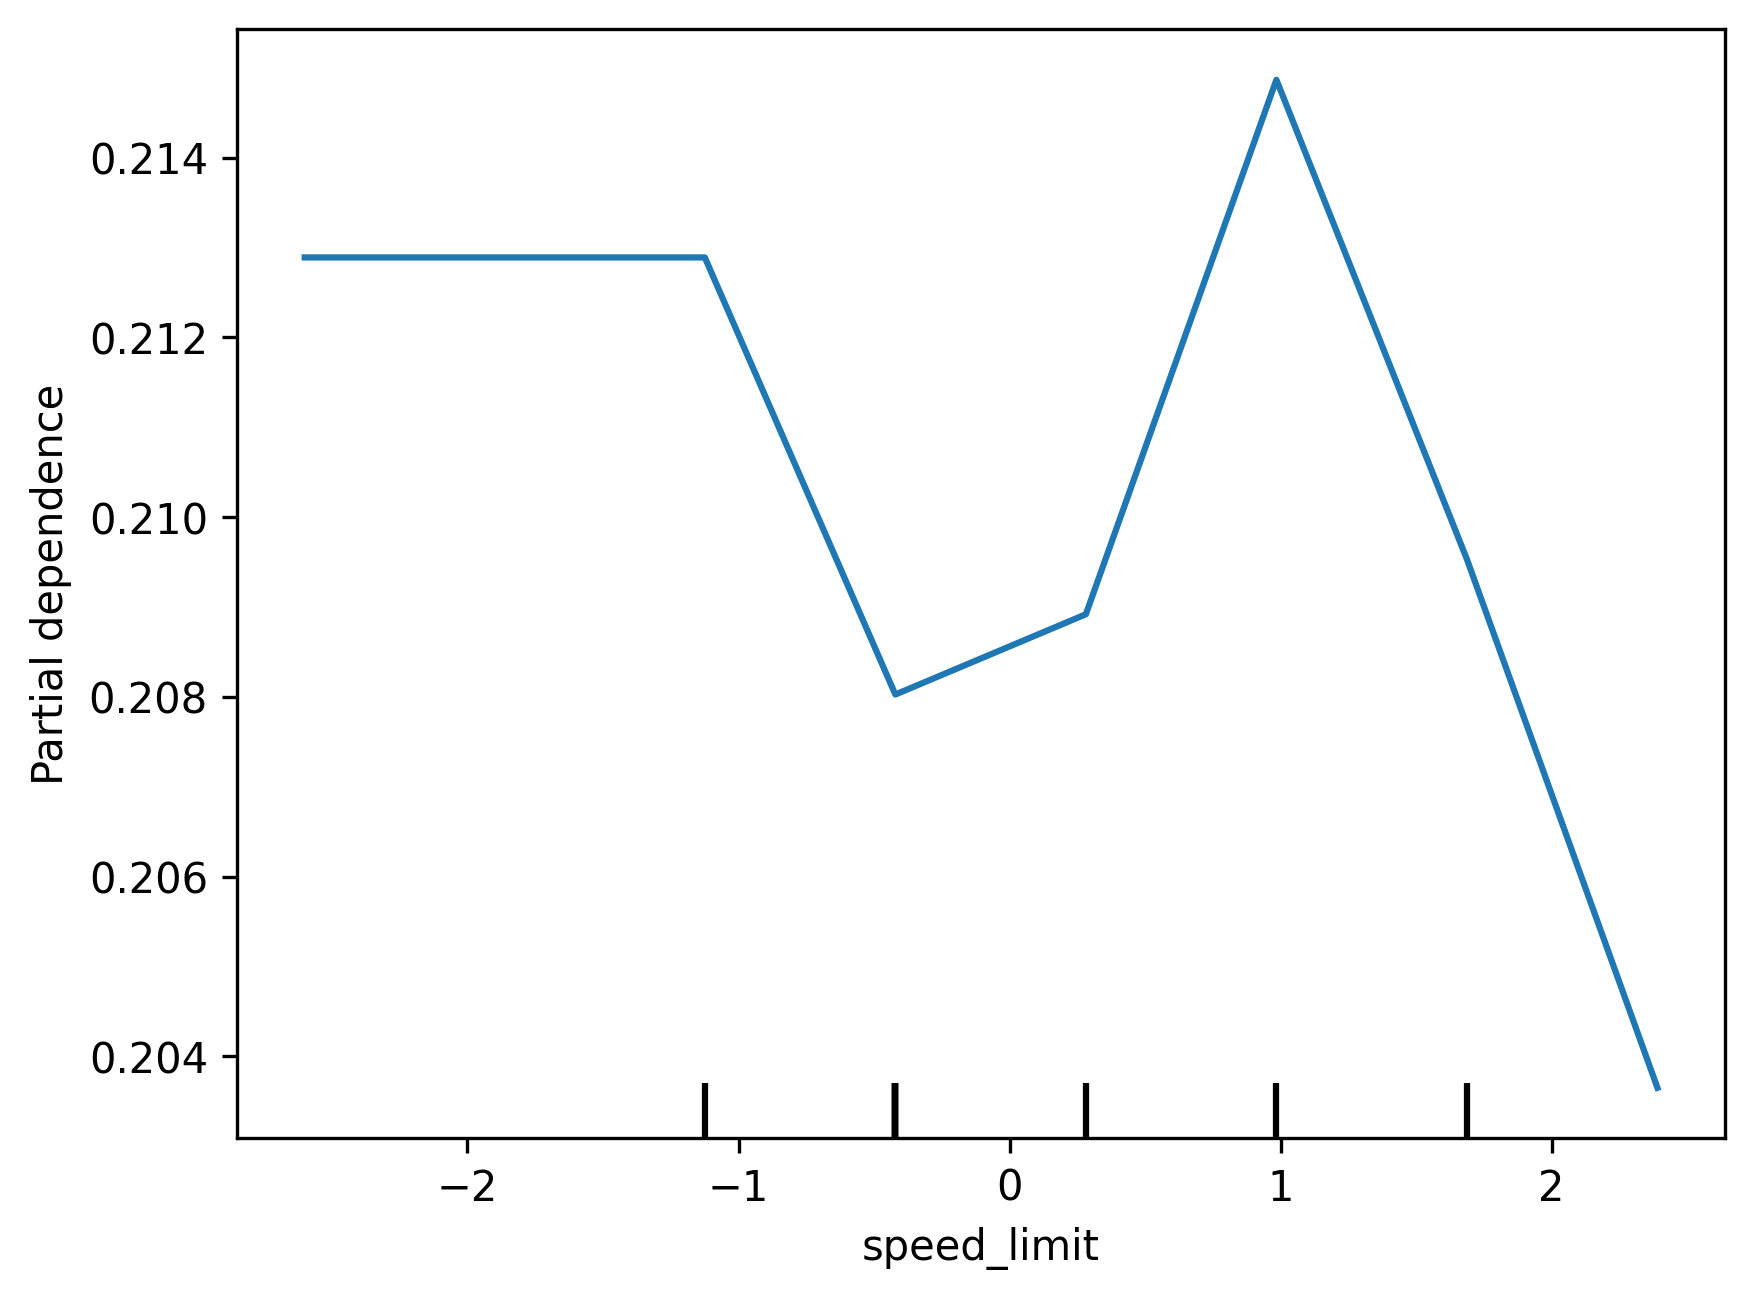
Partial Plots help explore the relationship between specific variables and a model's predictions. We can use them to help inform us how a particular feature shapes a model's decisions when it fluctuates. We have generated partial plots for a few numerical features in the dataset, such as time of day, to see how they impact collision severity. Interestingly, we find that even though the model does not consider some of these features very important, as seen in the Feature Importance chart, it seems to reflect reasonable relationships between said variables. For example, the model seems to recognise that there are less serious collisions from 5-8am, given a general decrease in road traffic. However, we also note that some parts of the plots seem to have erratic behaviour due to lack of training data.
Issues with our Models
Number of Incidents By Category
How many instances were there of each type of incident - Click a bar to highlight
Model Performance With vs Without Synthetic Data Injection
Comparing Model performance when trained with vs without synthetic data - Click a bar to highlight
A major challenge faced by the team involved working with heavily biased datasets, and fitting our model around this. This was a natural occurence due to how collisions are distributed across roads - the vast majority of collision incidents are minor, and thus categorised as slight, while only a very small portion of collisions are serious or fatal. This has led to a significant overfitting of any model towards slight collisions, and we see this in the model accuracy distribution. While the model tends to display an extremely high precision and recall for slight collisions, we can see a significant drop off in accuracy for the other two categories. We understand the model tends to categorise collisions as slight at a greater rate than the other two categories.
Attempts to correct this included the injection of synthetic data into the dataset, to simulate a greater rate of serious and fatal collisions, and while this appeared to increase model accuracy, we still find it to be lacking when predicting fatal collisions.